
Insights into China’s reopening based on alternative data

Macro Insight
Insights into China’s economic activity
Following unprecedented and widespread protests, China lifted its Covid restrictions in December, finally aligning its Covid policy with a world where economies and borders are largely reopened. The sudden and disruptive reopening contributed to a significant increase in Covid infections, and the situation has raised uncertainties for the recovery of the Chinese economy. There is also a growing concern for the impact on global markets, especially commodity prices.
QuantCube has analysed China’s reopening closely based on a diverse set of real-time alternative data, aiming to shed light on China’s economic recovery. Datasets we analysed include AIS vessel data to track trade in commodities, satellite imagery and air traffic data.
Iron Ore – China increases imports and triggers a rise in Spot prices
The QuantCube real-time iron ore imports indicator for China has increased by nearly + 27% year-on-year after hitting a low in September 2022. Supported by an increase in import volumes, spot prices for iron ore started to recover as Exhibit 1 indicates.
Beijing accounts for more than 70% of the world’s imports of the mineral, which is used to produce steel in blast furnaces. For this reason, iron ore imports and prices often reflect the health of the Chinese economy, or at least the market perception of it. In September and October last year, Chinese imports of the mineral fell sharply as a series of Covid-19 outbreaks hit the country. As a result, iron ore spot prices too fell sharply as the demand subsided.
In October last year, spot prices recorded a sharp drop to the level of nearly US $80/ton, but since then have started to rebound strongly. In January this year, iron ore spot prices recorded a six-month high.

However, it may be too early to determine whether iron ore imports and prices will continue to rise as this largely depends on how China will stimulate its economy, especially the steel-intensive property construction sector. Indeed, China’s property market accounts for a sizeable portion of domestic steel demand, but the sector has been struggling with a severe debt crisis in the last two years.
Energy commodities - China accelerates imports
QuantCube’s real-time Crude Oil Imports Indicator for China rose significantly in the last three months, reaching a peak on January 5. Despite a deceleration of this trend in the last three weeks, China’s oil imports remain elevated as shown in Exhibit 2.

What is driving the strong increase in crude oil imports in China? We took a closer look at the origin of Chinese crude oil imports in the last three months as shown in Exhibit 3.

Saudi Arabia is the dominant crude oil exporter to China; and our observation seems to suggest that Chinese imports of Saudi oil were boosted right after President Xi Jinping's visit to Riyadh on December 7, where he confirmed his willingness to buy oil in Chinese Yuan, rather than U.S. dollars.
Looking at Russian oil, the situation looks different. After Russia’s invasion of Ukraine, China increased its imports of Russian oil, benefitting from discounted prices as Moscow sought to keep up export volumes after western countries turned to other suppliers. However, real-time QuantCube data suggests that things are changing, and daily Russian oil imports have been dropping over the last month. Curiously, Chinese imports of Russian oil started to slow in December 2022, when the EU prohibited all imports of Russian oil, and the G7 introduced a ban on using maritime insurance, finance and brokering supplied by western countries for seaborne Russian crude oil priced above $60 per barrel.
Although China is not a part of the coalition, it might be indirectly impacted by this latest wave of sanctions for several reasons. Firstly, protecting payment and ensuring secure transportation may have become more complex due to the restriction on insurance coverage, as most of these maritime services are provided by G7 and EU countries. Secondly, given the inability to use western infrastructure, both countries might be facing difficulties in sourcing enough vessels to move Urals crude oil from Russia's western ports to China. The decrease in Russian oil imports could also indicate increasing uncertainty about Russia’s reaction to the price cap – it could cut production in the near future - while the G7 sanctions on refined products from February this year will also affect Russian refined oil shipments.
It will be interesting to see if this slowdown in Russian oil imports will continue, or if China and Russia will manage to trade oil continuously, circumventing the latest price cap.
Crude oil is not the only energy commodity China is restocking. Exhibit 4 shows the QuantCube real-time LNG imports indicator for China. The indicator recorded that Chinese LNG imports more than doubled in the last three months.

China’s domestic demand –Air transportation consumption and industrial activity remain weak
QuantCube’s real-time data shows a general increase in commodity imports by China over the last few months.
Does this mean that domestic demand and consumption in China are recovering?
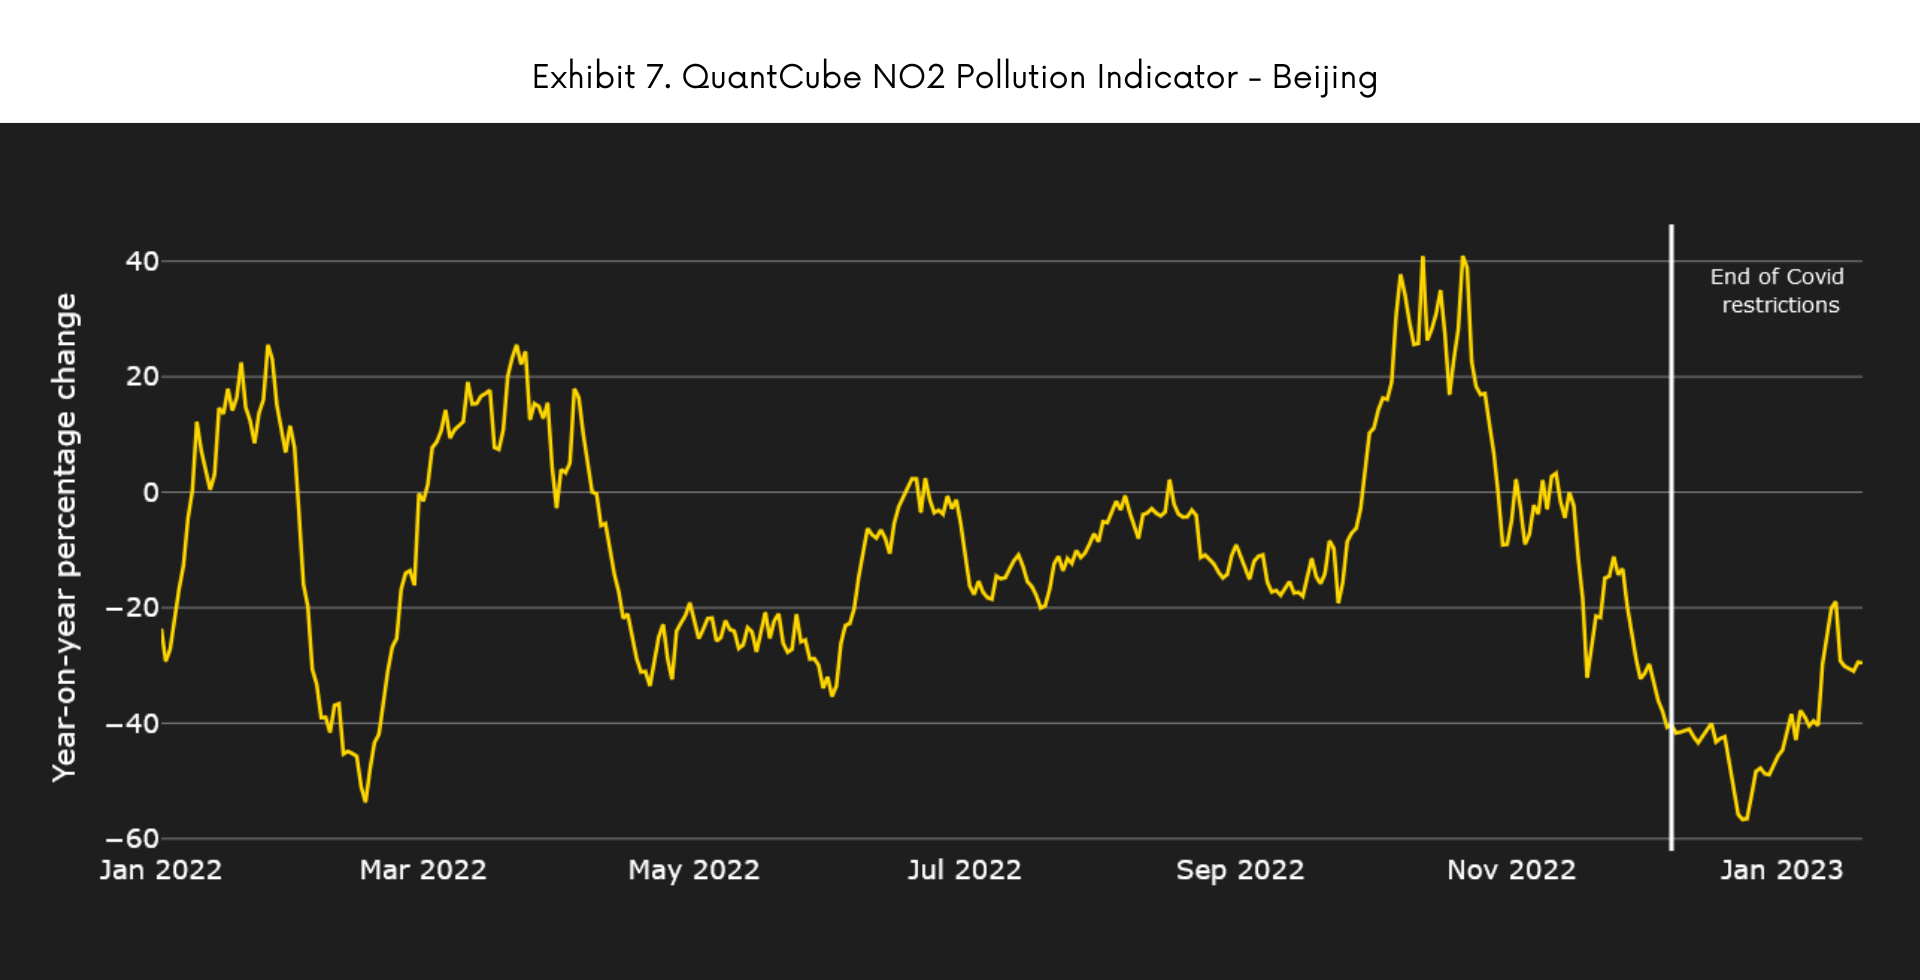
To examine if the rise in energy commodity imports corresponds to an increase in domestic demand, we looked at the QuantCube China Air Traffic Indicator and NO2 Pollution Indicator above some Chinese cities. These indicators provide timely insights into the current state of mobility and industrial activity.
Exhibit 5 represents the evolution of the QuantCube Air Traffic Indicator for China. The indicator analyses and aggregates flight arrivals and departures in real-time for the main airports in China, therefore, it is a good proxy for fuel demand. After reporting a negative trend in Fall 2022 we observe an inflection point at the end of last year that corresponds to the end of Covid restrictions. However, the level of air transportation demand is still very low compared to the pre-pandemic levels, where the QuantCube Air Traffic Indicator level stood at above 100.

In Exhibits 6 and 7 we examine the evolution of the QuantCube NO2 Pollution Indicators above the cities of Guangzhou and Beijing. NO2 is a greenhouse gas that is mainly emitted by heavy industry and transportation. Based on real-time satellite imagery, it provides valuable and timely insights into the levels of industrial production and mobility. The indicators started to trend positive in December 2022, when the Chinese government lifted its Covid restrictions. However, the levels of NO2 concentration seem to be slow to rebound. Indeed, they are still negative on a year-on-year basis. This slow take-off could also be linked to the Lunar year holidays, during which productivity is usually limited.

Markets and policymakers are monitoring a potential Chinese revival
The previous analysis suggests that despite a strong rise in energy commodity imports, domestic demand and industrial productivity in China have recorded limited growth so far. There are two possible reasons. Firstly, China is now facing a huge wave of Covid cases that is hindering a speedy recovery. Secondly, Chinese refiners and LNG importers might be taking advantage of bargain prices in energy commodities.
At the moment, price increases for natural gas and oil seem to be well contained helped by the current lukewarm Chinese domestic demand for fuel, a mild winter and increasing fears of a global recession. However, markets and policymakers are closely monitoring whether the end of Covid restrictions will help China’s recovery once the Lunar New Year holiday season is over. Indeed, rapid growth in the Chinese economy would most likely boost global demand for crude and refined oil, liquefied natural gas and other commodities. This would potentially lead to higher prices and put pressure on global central banks to control inflation.
Based on real-time alternative data analytics, QuantCube will continue to monitor the rapidly evolving situation for China’s economic recovery. In our view, the insights from China often provide early signals for the future trajectory of major global economies, therefore, it is important to understand the actual situation using real-time data.