
Wheat outlook for 2024 – exploring the impact of climate events

Commodities Insight
QuantCube provides wheat outlook for 2024
In recent years, the wheat market has experienced significant uncertainties due to adverse weather conditions, global economic shifts, and geopolitical conflicts. These factors have led to increased volatility in futures prices for wheat, impacting markets and the outlook for food inflation.
Using proprietary modelling techniques informed by agricultural expertise, QuantCube has developed Agricultural Yield Forecasts that provide real-time insights into the expected yields of major crops worldwide. Our indicators are designed to identify production shocks early on in the season, relying on two main inputs:
Vegetation Index: Using satellite imagery, QuantCube assesses vegetation health and density, providing critical insights into crop conditions from germination to flowering.
Meteorological Data: QuantCube monitors climatic factors that could adversely affect crop growth, such as temperature fluctuations and rainfall patterns.
Based on this data, we have analysed crop conditions in the world’s top wheat-producing and exporting countries. Our analysis indicates an improved overall outlook for wheat production for 2024, though several challenges remain.
US winter wheat harvest poised for record abundance
After a challenging period in the early 2020s, the United States is poised to experience a large wheat harvest this year.Our winter wheat yield indicator for the US in 2024 (Exhibit 1) shows a yield significantly above average compared to previous years’ forecasts, which often grew increasingly pessimistic due to unfavourable weather conditions. This year, however, the crop yield and productivity forecast have remained stable with the onset of the summer season.

Let’s consider the factors contributing to the favourable conditions for US wheat.
1) Drought conditions eased in 2024:
Unlike previous years, when grain-producing states endured severe droughts during crucial crop growth stages, this year has seen improved conditions. The QuantCube Drought Indicator monitors the latest drought conditions affecting wheat-producing regions. Leveraging satellite and meteorological data on rainfall and temperatures, the indicator examines drought conditions daily at both a regional and national level.
As shown in Exhibit 2, drought conditions across the wheat producing states in the United States have been decreasing since late 2023.

We can also use the QuantCube Regional Drought Indicator to zoom in for a more detailed view of dry weather conditions. As shown in Exhibit 3, there are now almost no areas in Kansas and Texas experiencing severe or extreme water stress, contributing to the favourable outlook.


2) NDVI data indicates healthy crop growth
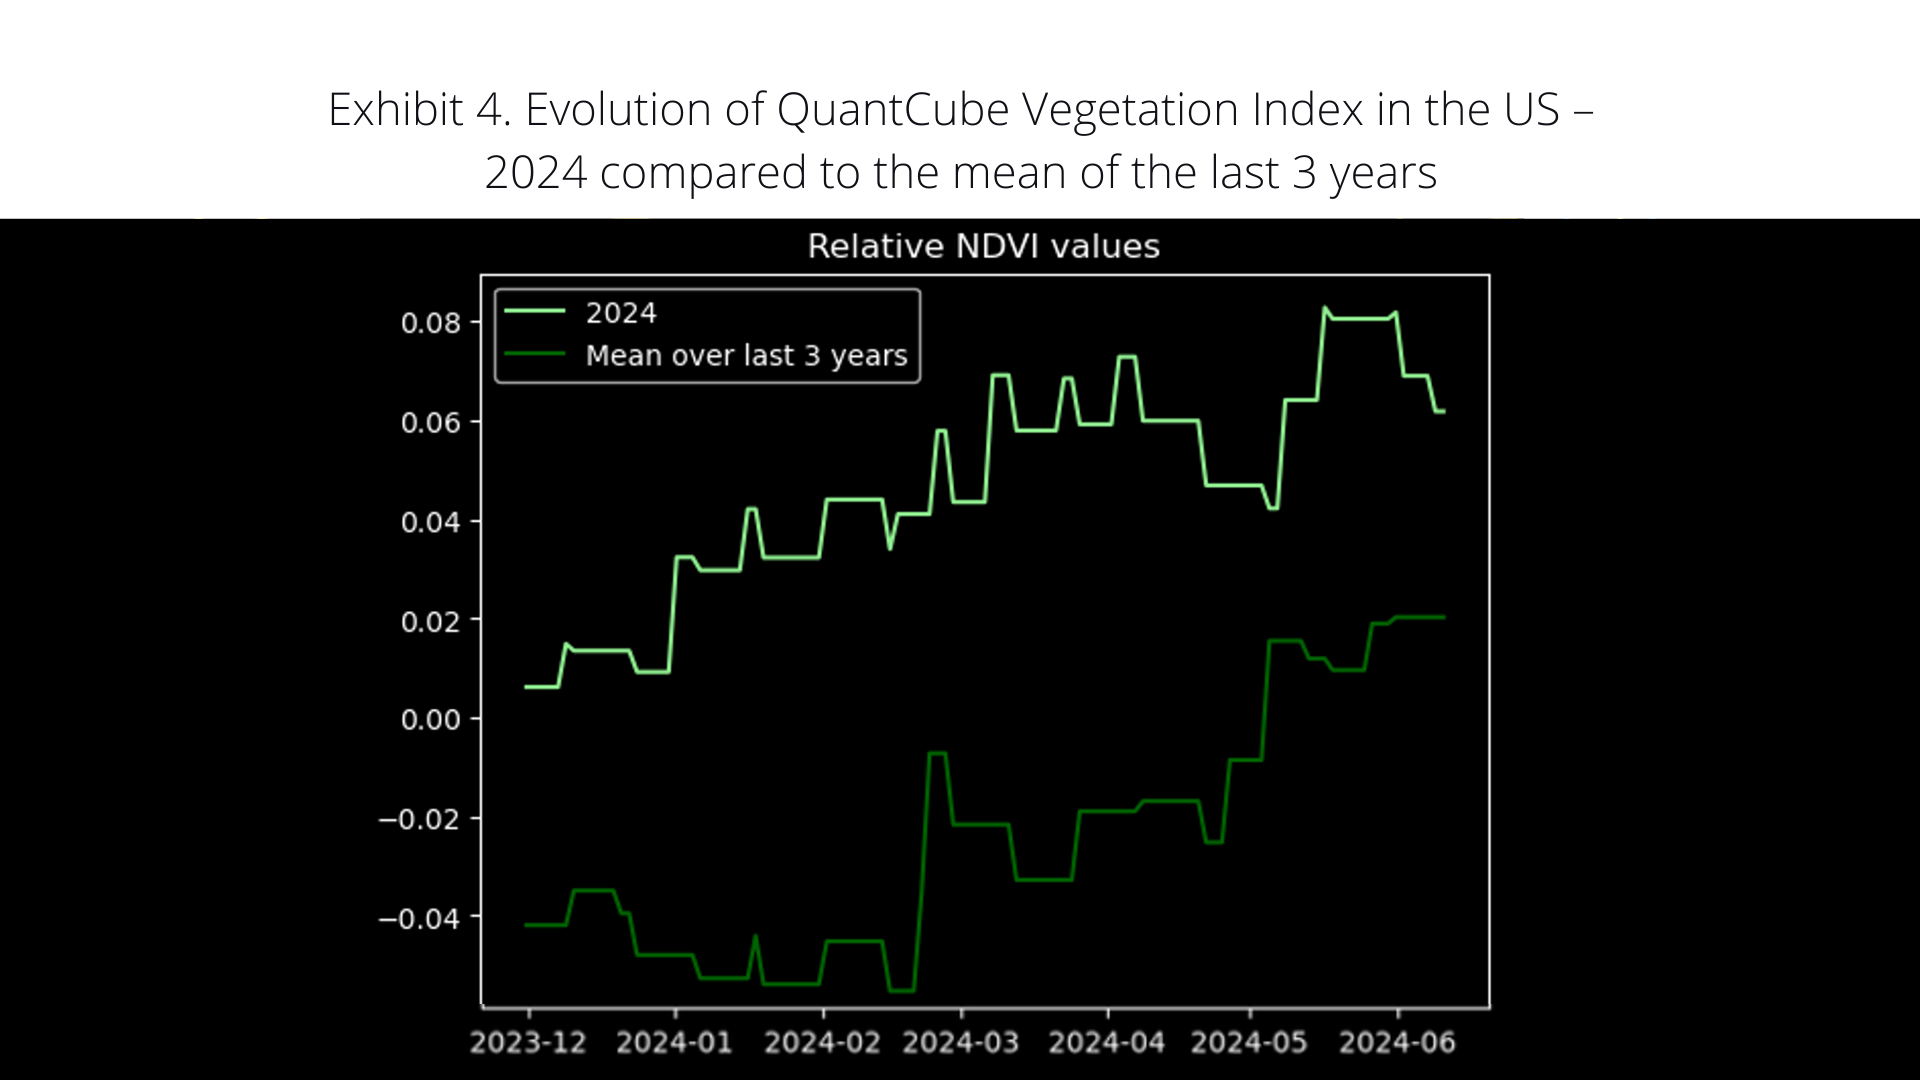
QuantCube Normalized Difference Vegetation Index (NDVI) is another critical component of our agricultural yield indicator. This index, derived from optical satellite imagery of crops, tracks crop health and developmental status relative to their phenological stages. Our data suggests that this year, the NDVI in the United States is significantly higher compared to the past three years, suggesting that crops are generally growing healthily (Exhibit 4).
3) Stable and favourable conditions observed at key seasonal checkpoints in the US
The favourable conditions mentioned earlier have led our models to assess that a large part of wheat fields in the United States are in excellent condition after the germination and tillering stages. Our projections indicate that around 40% of these fields completed the germination in excellent condition. As shown in Exhibit 5, this percentage remained consistent throughout the tillering phase.

France - winter crops hit by heavy rainfall
In France, our wheat yield predictions for 2024 were consistent with previous years until April, as shown in Exhibit 6. However, the country has since been affected by substantial rainfall. During the advanced phenological stage of crop development, excessive rain can lead to detrimental effects such as water logging, soil erosion, and heightened vulnerability to diseases. These conditions pose a significant risk to crop growth and can substantially diminish both the quality and quantity of the wheat yield.

Exhibit 7 illustrates the rainfall patterns in France in 2024 compared to the average of the three previous years. Persistent wet weather, coupled with unpredictable temperature fluctuations, have created challenging conditions for wheat growers in France.


These conditions resulted in highly unfavorable conditions during the tillering phase of wheat plants in France in 2024. Exhibit 8 illustrates crop conditions at critical stages of development in France. At the end of the Tillering stage, nearly 98% of crops were classified in “unfavourable conditions”. While somewhat alleviated by average meteorological conditions later in the season, the initial damage has set a pessimistic tone for our predictions.
QuantCube Agricultural Yield Indicators: comprehensive and transparent methodology
Our indicators blend complexity with transparency to provide precise and actionable insights.We use a multi-layered model that analyses each stage of crop development, from germination to flowering (see Exhibit 9).

To achieve this, our model tracks the evolving relationships between variables and expected yield throughout the season, as illustrated in Exhibit 10. For example, drought conditions exert a more significant impact on crop health during early development stages when young plants are particularly vulnerable and have not yet established strong root systems. Conversely, excessive rainfall can detrimentally affect crops in later stages, leading to diseases and disrupting pollination.
In addition, our model uses a multi-layered approach to continuously accumulate knowledge. We conduct ongoing monitoring of each parcel of land, assessing its condition at the conclusion of every growth stage. This data is subsequently integrated into future analyses to enhance the accuracy of our predictions. For example, if a parcel of land is classified as "unfavourable" after germination, the forecasted yield for this parcel will be adjusted downward for the remainder of the season.

Outperforming the consensus
Our daily yield predictions cover over 20 countries, providing crucial insights for investment strategies in wheat, other grains, and soft commodities. By integrating this timely, accurate, and valuable data, investors can optimise their financial performance and make informed decisions.
These daily yield forecasts offer insights several months ahead of official data releases. The following Exhibit 11 compares QuantCube's yield predictions with those from the USDA and last year’s official data.
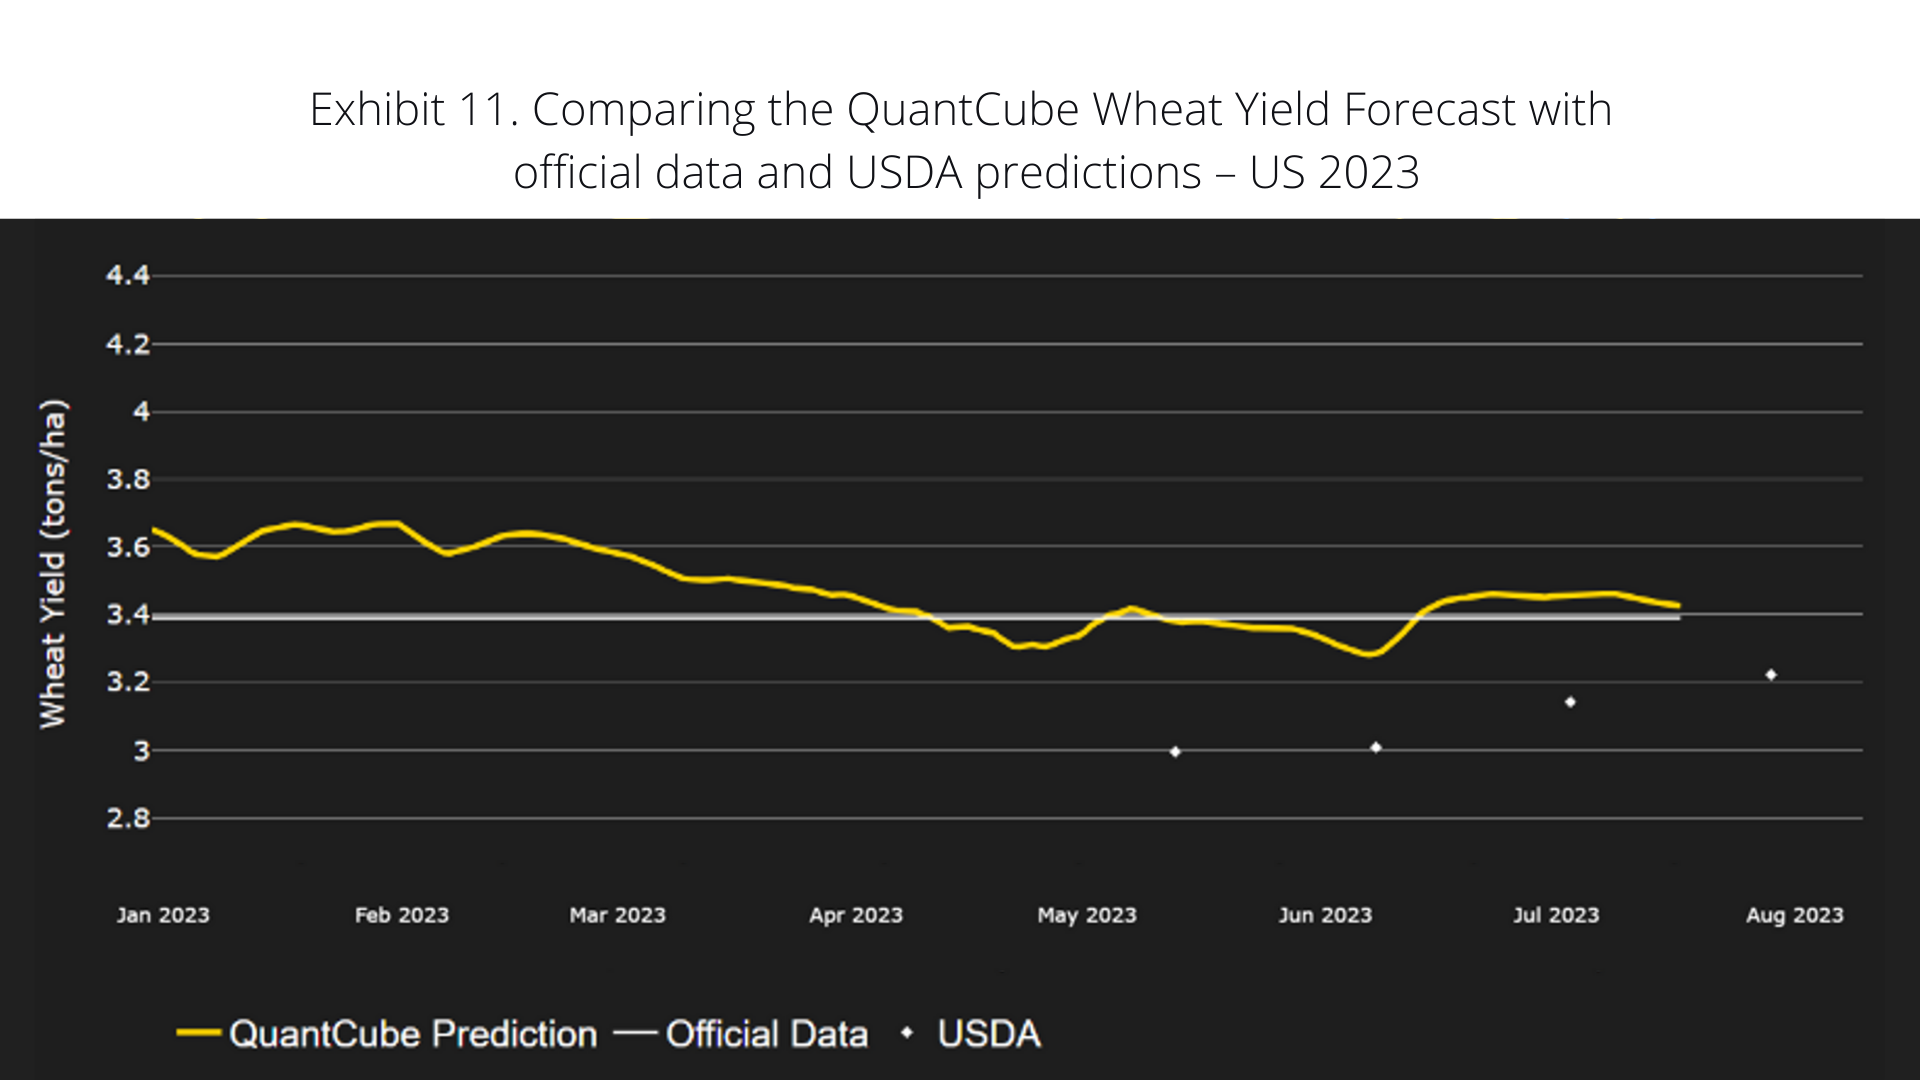
QuantCube initiates its yield and production predictions as early as December, whereas the USDA only makes its initial forecast in May of the following year. The early detection of production shocks impacting the productivity of various commodities makes our indicator indispensable in navigating the complexity of commodities markets and in supporting well-informed decisions.
Enhancing wheat futures trading with QuantCube real-time data
The QuantCube Yield Forecast Indicators are used by investors to monitor real-time crop conditions dynamically and devise systematic trading strategies for agricultural commodities futures. Exhibit 12 showcases the performance of a long/short strategy on Hard Red Wheat Kansas futures.

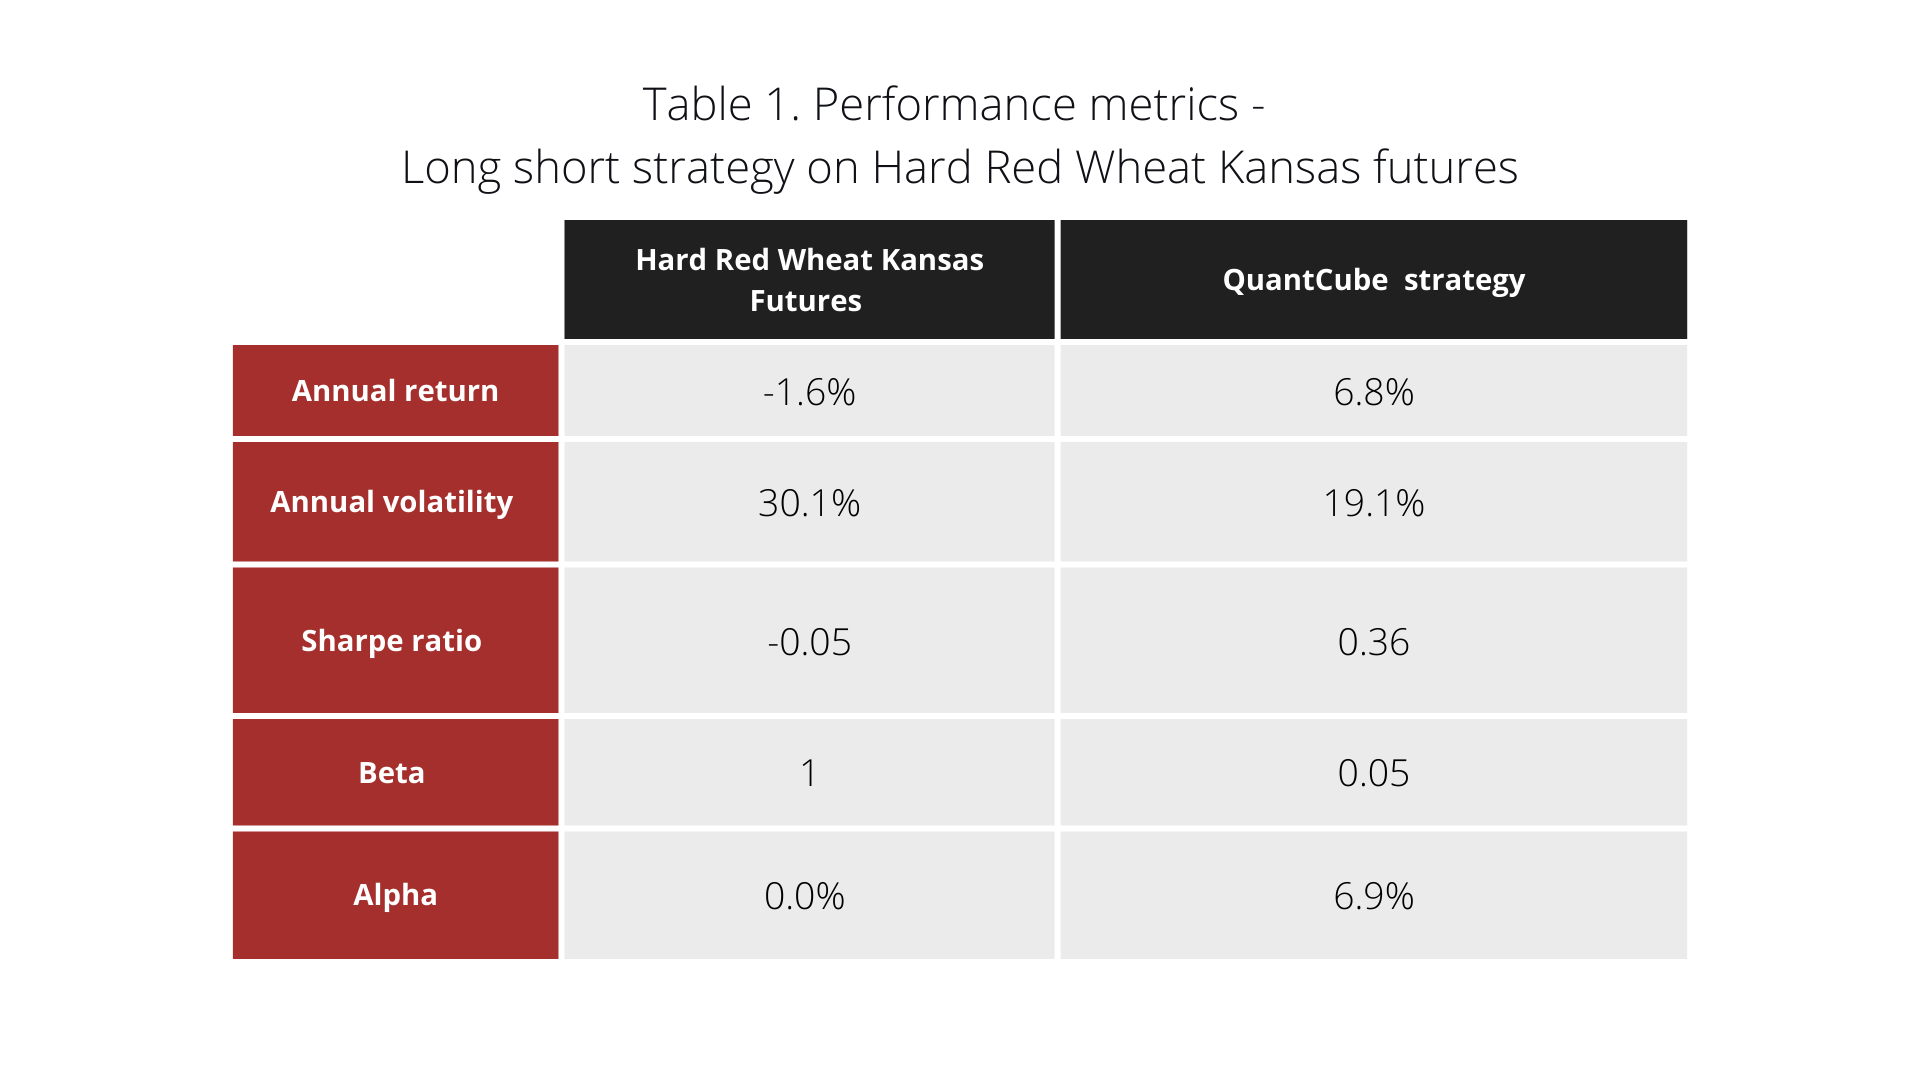
This strategy generates buy and sell signals based on the anticipated changes in wheat supply, driven by fluctuations in yield and production. The yellow line depicts the cumulative returns produced by this strategy, using signals derived from QuantCube’s aggregated Wheat Yield Forecasts across 12 major wheat-producing countries. When the indicator shows a positive trend, signaling expectations of abundant harvests, wheat futures prices are anticipated to decrease, presenting a sell opportunity. Conversely, a negative trend in the crop yield indicator, indicating limited grain availability, suggests a favourable long position in Kansas wheat futures to capture alpha.
Table 1 presents the performance metrics of this strategy compared to the benchmark, Kansas Hard Red Winter futures. Using the agricultural yield indicator improved the Sharpe ratio from -0.5 to 0.36.
In our view, consistent monitoring of agricultural commodities yield is crucial for informing trading strategies and enhancing financial performance.